
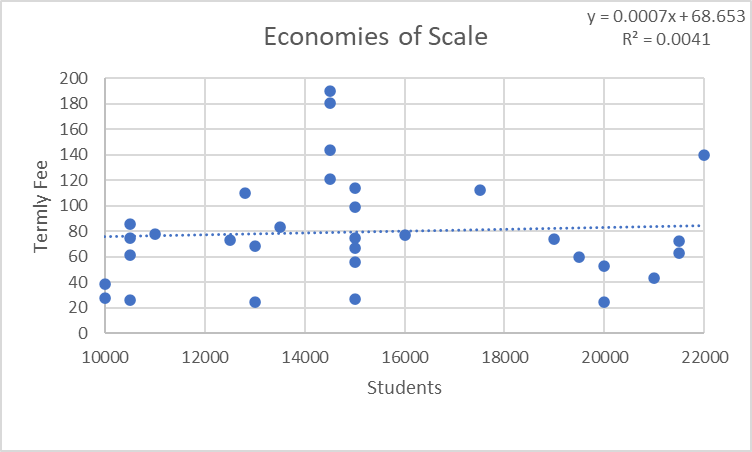
Today’s figure is R2=0.004, which is how strongly the size of BUGs membership predicts student fees . And it is not much at all. Combined with the low coefficient in the formula, we can see that bigger associations don’t lower their fees, if anything they’re higher.
Methods
These figures are annoyingly inexact. Some associations have new student buildings, some have old. Where there was a separate student building fee, it was excluded due to the supposition that once the building is paid off, those fees would come down. However, it is impossible to predict what the operating costs would be. Similarly, some institutions had different fees at a satellite campus, some had much older fee data, and in some cases, whether to include campus media or radio was unclear, and treatment may have been inconsistent. I do have confidence that a more thorough analysis would probably not change that co-efficient or R-value to anything worth sniffing at.
Conclusions
So, what do we learn from this? Student associations seem to grow outwards, adding new functionality as more students are added, rather than using economies of scale to grow leaner, or cutting the fees charged to students to deliver the same functionality.
This is logical from how we think about student associations. Our inherent conception of smaller associations is that they offer fewer and smaller services, and that larger ones tend to offer more services. If there is an association that has grown and used that growth to maintain services and reduce fees, it doesn’t jump to mind, but if I find one, I’ll be excited to make a case study of it.
And with that, we’re #OFF.

Leave a comment